
GitHub Repository PyPI Package
Machine learning often relies on complex models that act as “black boxes,” making interpretation difficult. However, a new approach called Eigen-Component Analysis (ECA) brings quantum theory inspiration to create interpretable models. This article explores how ECA offers an innovative alternative for both classification and clustering tasks.
Table of Contents
What is Eigen-Component Analysis?
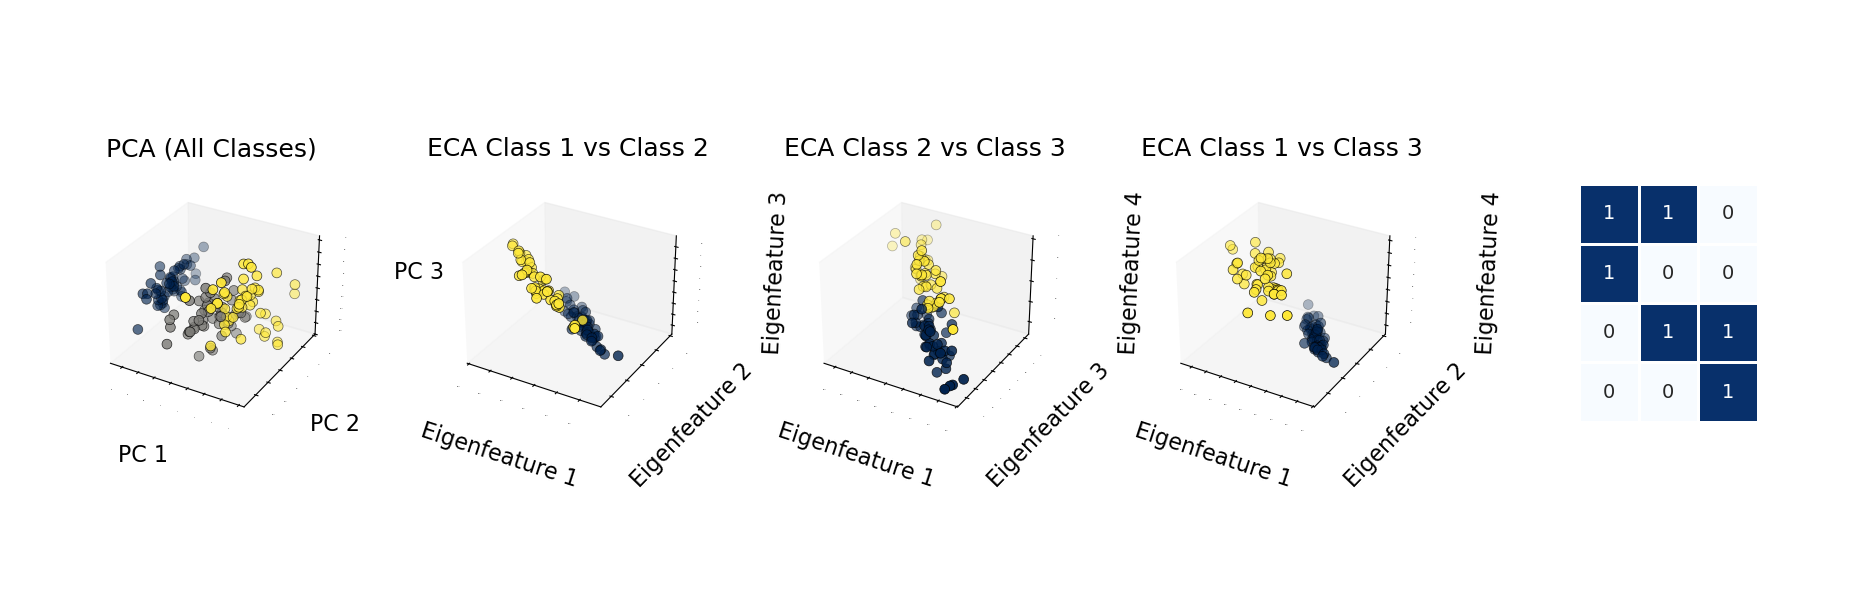
Eigen-Component Analysis represents a novel approach that applies principles from quantum theory to create linear models for classification and clustering. Unlike many traditional methods, ECA doesn’t require data centralization or standardization, making it both efficient and mathematically elegant.
The most compelling aspect of ECA is its interpretability – the model provides clear feature-to-class mappings through eigencomponents, allowing researchers and data scientists to understand why the model makes specific predictions.
Key Features and Advantages
ECA combines theoretical elegance with practical implementation:
- Scikit-learn Compatible Interface: The package implements the familiar scikit-learn Estimator API, making it accessible to anyone familiar with Python’s machine learning ecosystem.
- Versatile Learning Modes: ECA supports both supervised classification and unsupervised clustering through a unified API, with specialized implementations (ECA and uECA respectively).
- Hardware Acceleration: Built on a PyTorch backend, the package automatically leverages GPU acceleration when available, improving performance on large datasets.
- Visualization Tools: The package includes comprehensive visualization methods that help interpret eigenfeatures, mappings, and results.
- Mathematical Foundation: Based on principles from quantum theory, ECA uses antisymmetric transformation matrices to create robust model representations.
Getting Started with ECA
Installation is straightforward through either PyPI or from source:
# install.py
# Installation from PyPI
pip install eigen-analysis
# Or from source
git clone https://github.com/lachlanchen/eigen_analysis.git
cd eigen_analysis
pip install .
The package requires common data science libraries including numpy, torch, matplotlib, seaborn, scikit-learn, and scipy.
Using ECA for Classification
Let’s walk through how to use ECA for a classification task using the classic Iris dataset:
# iris_classification.py
import numpy as np
from sklearn import datasets
from sklearn.model_selection import train_test_split
from eigen_analysis import ECA
from sklearn.metrics import accuracy_score
from eigen_analysis.visualization import visualize_clustering_results
import traceback
# Set random seed for reproducibility
np.random.seed(23)
try:
# Load Iris dataset
iris = datasets.load_iris()
X = iris.data
y = iris.target
# Split data
X_train, X_test, y_train, y_test = train_test_split(X, y, test_size=0.2)
# Create and train ECA model
eca = ECA(num_clusters=3, num_epochs=10000, learning_rate=0.001)
eca.fit(X_train, y_train)
# Make predictions
y_pred = eca.predict(X_test)
# Evaluate accuracy
accuracy = accuracy_score(y_test, y_pred)
print(f"Test accuracy: {accuracy:.4f}")
# Get transformed data
X_transformed = eca.transform(X_test)
# Access model components
P_matrix = eca.P_numpy_ # Eigenfeatures
L_matrix = eca.L_numpy_ # Feature-to-class mapping
# Visualize results
visualize_clustering_results(
X_test, y_test, y_pred,
eca.loss_history_,
eca.transform(X_test),
eca.num_epochs,
eca.model_,
(eca.L_numpy_ > 0.5).astype(float),
eca.L_numpy_,
eca.P_numpy_,
"Iris",
output_dir="eca_classification_results_20250418"
)
except Exception as e:
traceback.print_exc()
Unsupervised Clustering with uECA
For unsupervised learning tasks, the uECA variant provides powerful clustering capabilities:
# clustering_example.py
import numpy as np
from sklearn.datasets import make_blobs
from eigen_analysis import UECA
from sklearn.metrics import adjusted_rand_score
from eigen_analysis.visualization import visualize_clustering_results
import traceback
# Set random seed for reproducibility
np.random.seed(23)
try:
# Generate synthetic data
X, y_true = make_blobs(n_samples=300, centers=3, random_state=42)
# Train UECA model
ueca = UECA(num_clusters=3, learning_rate=0.01, num_epochs=3000)
ueca.fit(X, y_true) # y_true used only for evaluation
# Access clustering results
clusters = ueca.labels_
remapped_clusters = ueca.remapped_labels_ # Optimal mapping to ground truth
# Evaluate clustering quality
ari_score = adjusted_rand_score(y_true, clusters)
print(f"Adjusted Rand Index: {ari_score:.4f}")
# Visualize clustering results
visualize_clustering_results(
X,
y_true,
ueca.remapped_labels_,
ueca.loss_history_,
ueca.transform(X),
ueca.num_epochs,
ueca.model_,
ueca.L_hard_numpy_,
ueca.L_numpy_,
ueca.P_numpy_,
"Custom Dataset",
output_dir="eca_clustering_results_20250418"
)
except Exception as e:
traceback.print_exc()
Advanced Visualization and Customization
The visualization capabilities of ECA go beyond basic plots. You can customize visualizations with feature and class names to create more meaningful and interpretable results:
# custom_visualization.py
# Customize visualization with feature and class names
visualize_clustering_results(
    X, y, predictions,
    loss_history, projections, num_epochs,
    model, L_hard, L_soft, P_matrix,
    dataset_name="Iris",
    feature_names=["Sepal Length", "Sepal Width", "Petal Length", "Petal Width"],
    class_names=["Setosa", "Versicolor", "Virginica"],
    output_dir="custom_visualization_20250418"
)
For image datasets like MNIST, specialized visualization functions provide insights into how the model interprets visual data:
# mnist_example.py
import numpy as np
from torchvision import datasets, transforms
from eigen_analysis import ECA
from eigen_analysis.visualization import visualize_mnist_eigenfeatures
import traceback
# Set random seed for reproducibility
np.random.seed(23)
try:
# Load MNIST
mnist_train = datasets.MNIST('data', train=True, download=True)
X_train = mnist_train.data.reshape(-1, 784).float() / 255.0
y_train = mnist_train.targets
# Train ECA model
eca = ECA(num_clusters=10, num_epochs=1000)
eca.fit(X_train, y_train)
# Visualize MNIST eigenfeatures
visualize_mnist_eigenfeatures(eca.model_, output_dir='mnist_results_20250418')
except Exception as e:
traceback.print_exc()
Tuning Model Parameters
Both ECA variants offer customizable parameters to optimize for specific datasets:
ECA Model (Supervised Classification)
num_clusters: Number of classeslearning_rate: Learning rate for optimizer (default: 0.001)num_epochs: Number of training epochs (default: 1000)temp: Temperature parameter for sigmoid (default: 10.0)random_state: Random seed for reproducibilitydevice: Device to use (‘cpu’ or ‘cuda’)
uECA Model (Unsupervised Clustering)
num_clusters: Number of clusterslearning_rate: Learning rate for optimizer (default: 0.01)num_epochs: Number of training epochs (default: 3000)random_state: Random seed for reproducibilitydevice: Device to use (‘cpu’ or ‘cuda’)
The Science Behind ECA
ECA draws inspiration from quantum theory to create a mathematically sound approach to classification and clustering. The antisymmetric transformation matrices used in ECA provide a unique way to represent data that maintains interpretability while achieving competitive performance.
For researchers looking to build upon this work, the project can be cited:
@inproceedings{chen2025eigen,
  title={Eigen-Component Analysis: {A} Quantum Theory-Inspired Linear Model},
  author={Chen, Rongzhou and Zhao, Yaping and Liu, Hanghang and Xu, Haohan and Ma, Shaohua and Lam, Edmund Y.},
  booktitle={2025 IEEE International Symposium on Circuits and Systems (ISCAS)},
  pages={},
  year={2025},
  publisher={IEEE},
  doi={},
}
Conclusion
Eigen-Component Analysis represents an exciting development in machine learning, bringing quantum-inspired principles to classification and clustering tasks. The combination of interpretability, performance, and mathematical elegance makes it worth exploring for both research and practical applications.
By providing a scikit-learn compatible implementation and comprehensive visualization tools, the eigen-analysis package makes this innovative approach accessible to data scientists and researchers alike. Whether you’re analyzing tabular data or working with image datasets like MNIST, ECA offers a fresh perspective on extracting meaningful patterns from data.
Try it out today by installing from PyPI or cloning the GitHub repository, and experience the unique insights that quantum-inspired machine learning can provide.